75+ Powerful Divi ModulesDivi Advanced Chart
Create stunning bar, line, pie, and radar charts in Divi Advanced Chart. Full control over datasets, legends, tooltips, and axes, no coding required.

Why Smart Divi Builders Choose Divi Advanced Chart
The Divi Advanced Chart embeds stunning, fully branded data visualizations into Divi, delivering pixel-perfect control that turns complex data into converting insights.
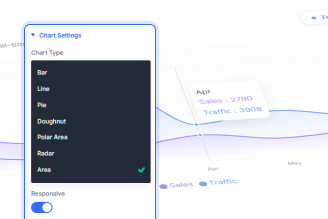
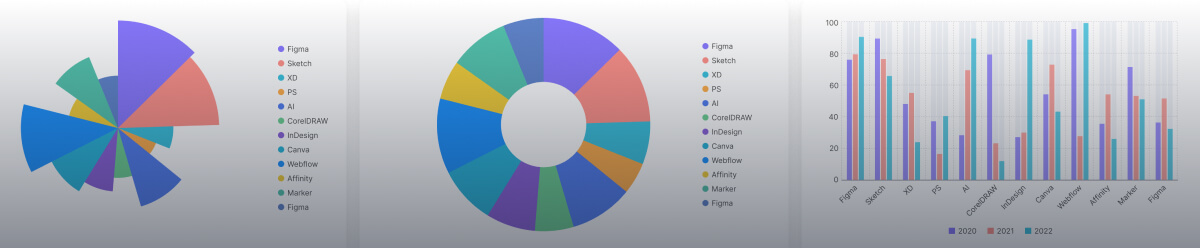
7 Chart Types Built In
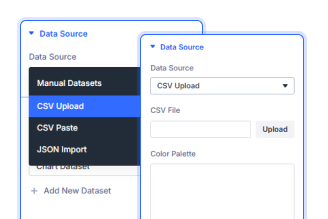
Multiple Dataset Support
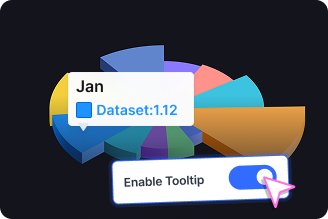
Fully Styled Tooltips
Key FeaturesFully Customizable Divi Advanced Chart
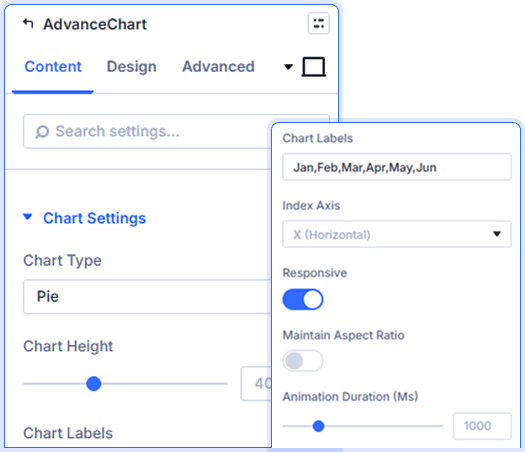
Complete Chart Configuration Control
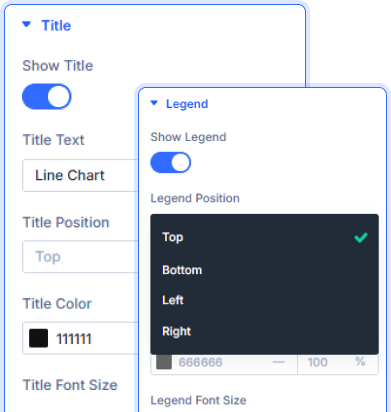
Smart Title and Legend Positioning
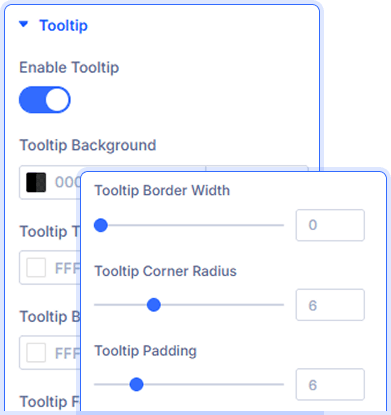
Fully Customizable Chart Tooltips
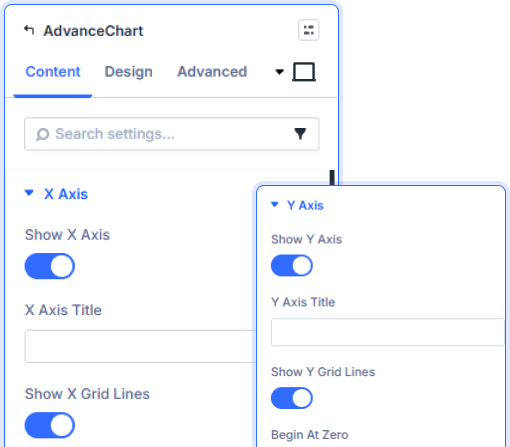
Granular Axis Display Controls
Show or hide X and Y axes independently. Add custom axis titles, toggle grid lines, and set Y axis to begin at zero for cleaner data presentation.
prebuild sectionGet Started with Our Pre-made Layouts
Quick StepsHow to Add an Divi Advanced Chart in 3 Steps
Install Divi Essential and activate your license key.
Drop the Divi Advanced Chart module onto your page.
Add your datasets, style your chart,
and publish.
Launch A Stunning Experience Add
Social Sharing In Minutes!
Frequently Asked Questions
Do you have any questions or concerns? Here is a list of frequently asked questions and their answers that might be helpful.
Divi Essential Help Center or Contact Us.
What chart types does the module support?
The module supports 7 chart types: Bar, Line, Pie, Doughnut, Polar Area, Radar, and Area—all switchable from a single dropdown in the Divi builder.
Can I add multiple datasets to one chart?
Yes! You can add unlimited datasets, each with its own label, color, and data values. Simply click Add New Dataset to build multi-series charts.
Can I customize the Divi Advanced chart tooltip design?
Absolutely! Style tooltip background, title color, body color, font size, border color, border width, corner radius, and padding—all from the Content tab.
Is the chart responsive on mobile devices?
Yes. Toggle Responsive on to make charts adapt to any screen size. You can also enable Maintain Aspect Ratio for consistent proportions across devices.
Can I control the X and Y axis display?
Yes! Show or hide each axis independently, add custom axis titles, toggle grid lines on or off, and set the Y axis to begin at zero for cleaner charts.
Can I control chart animation speed?
Yes. Use the Animation Duration slider in Chart Settings to control how fast your chart animates on load—measured in milliseconds for precise control.
✨ More Ways to Enhance Your Divi Experience
Divi Text Marquee
Create scrolling text announcements with smooth animations & custom icons.
Divi Time Count Down
Build urgency with customizable countdown timers for sales & events.
Divi Interactive Circle
Showcase features in stunning circular layouts with interactive animations.
Divi Scroll Stacking Cards
Captivate visitors with scroll-triggered card stacks for features & portfolios.
Mega Saver Offer!Unlock Endless Design Possibilities with All Access Pass!
Unlock 17+ plugins, 80+ modules, 750+ layouts & more with Divi Next’s All Access Pass! Experience the ultimate Divi builder toolkit. Grab your lifetime access today!